背景
在上一篇《从 Dapper 到 OpenTelemetry:分布式追踪的演进之旅》 中在最后提到在做一些 Trace 的定制开发。
到现在差不多算是完成了,可以和大家分享一下。
我们的需求是这样的:
ServiceA 对外提供了一个 http 接口 request,在这个接口会调用 ServiceB 的 order 订单接口创建订单,同时 serviceB 调用 serviceC 的 pay 接口。
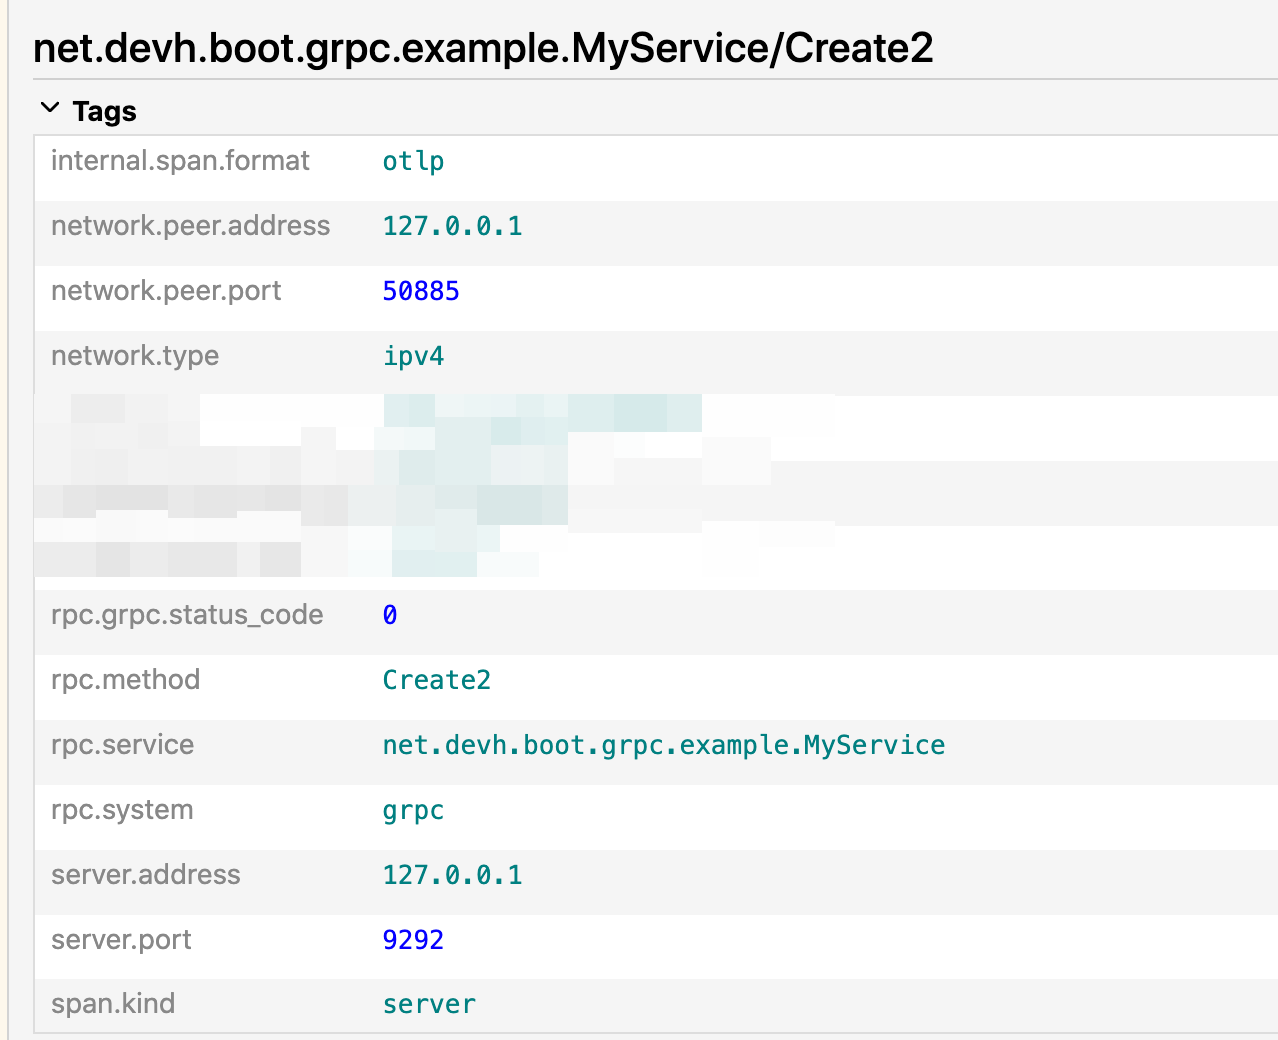
默认情况下 span 中的 attribute 会记录当前 span 的一些信息,比如:
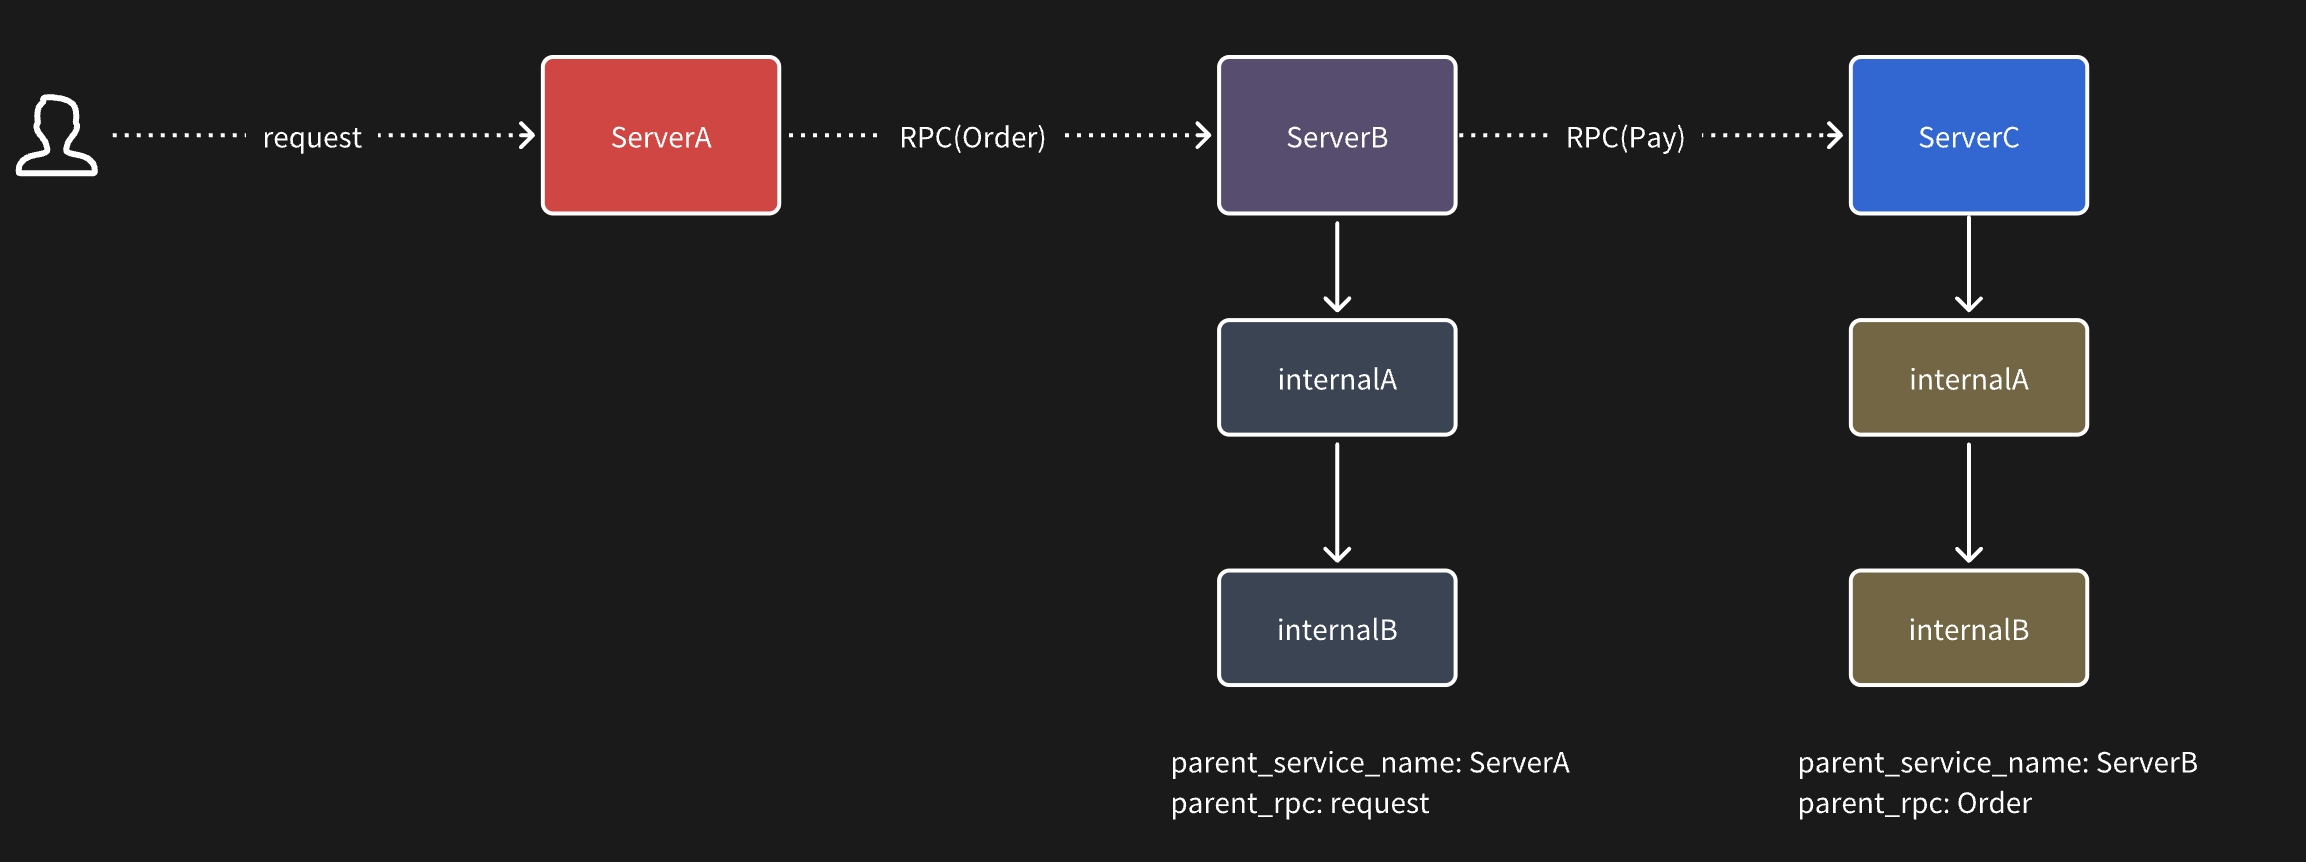
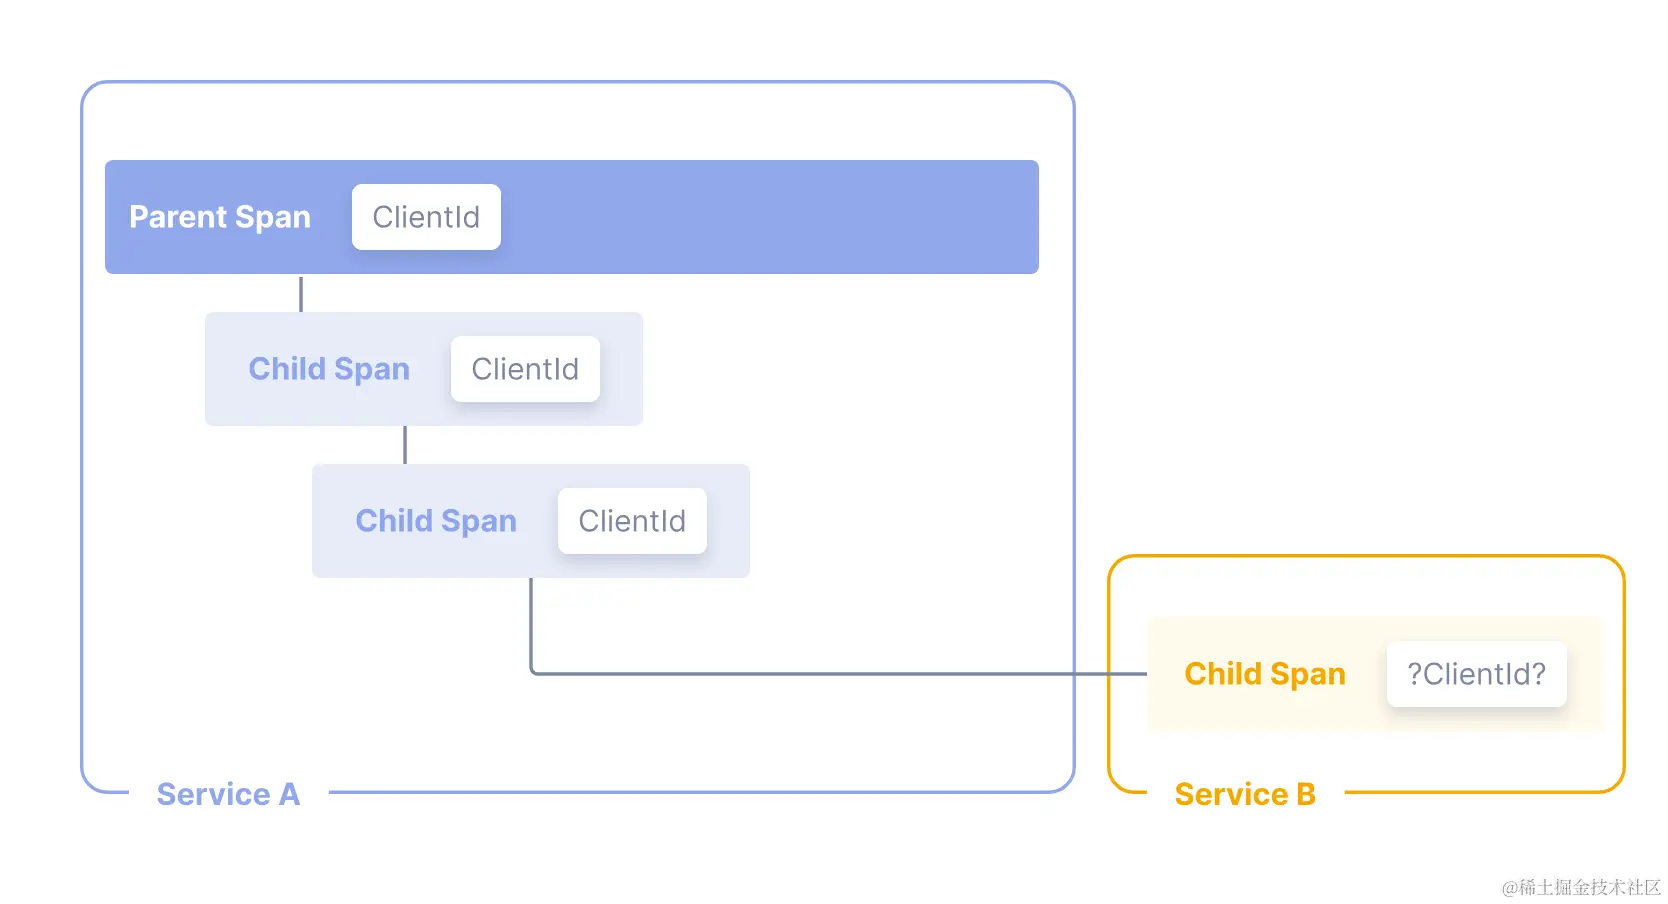
但这里并没有上游的一些信息,虽然我们可以通过 Jaeger 的树状图得知上游是哪个应用调用过来的,但是一旦某个 span 下有多个子 span 的调用,就没办法很直观知道这个子 span 的上游是由谁发起的调用。
比如如下这个链路:
预期效果
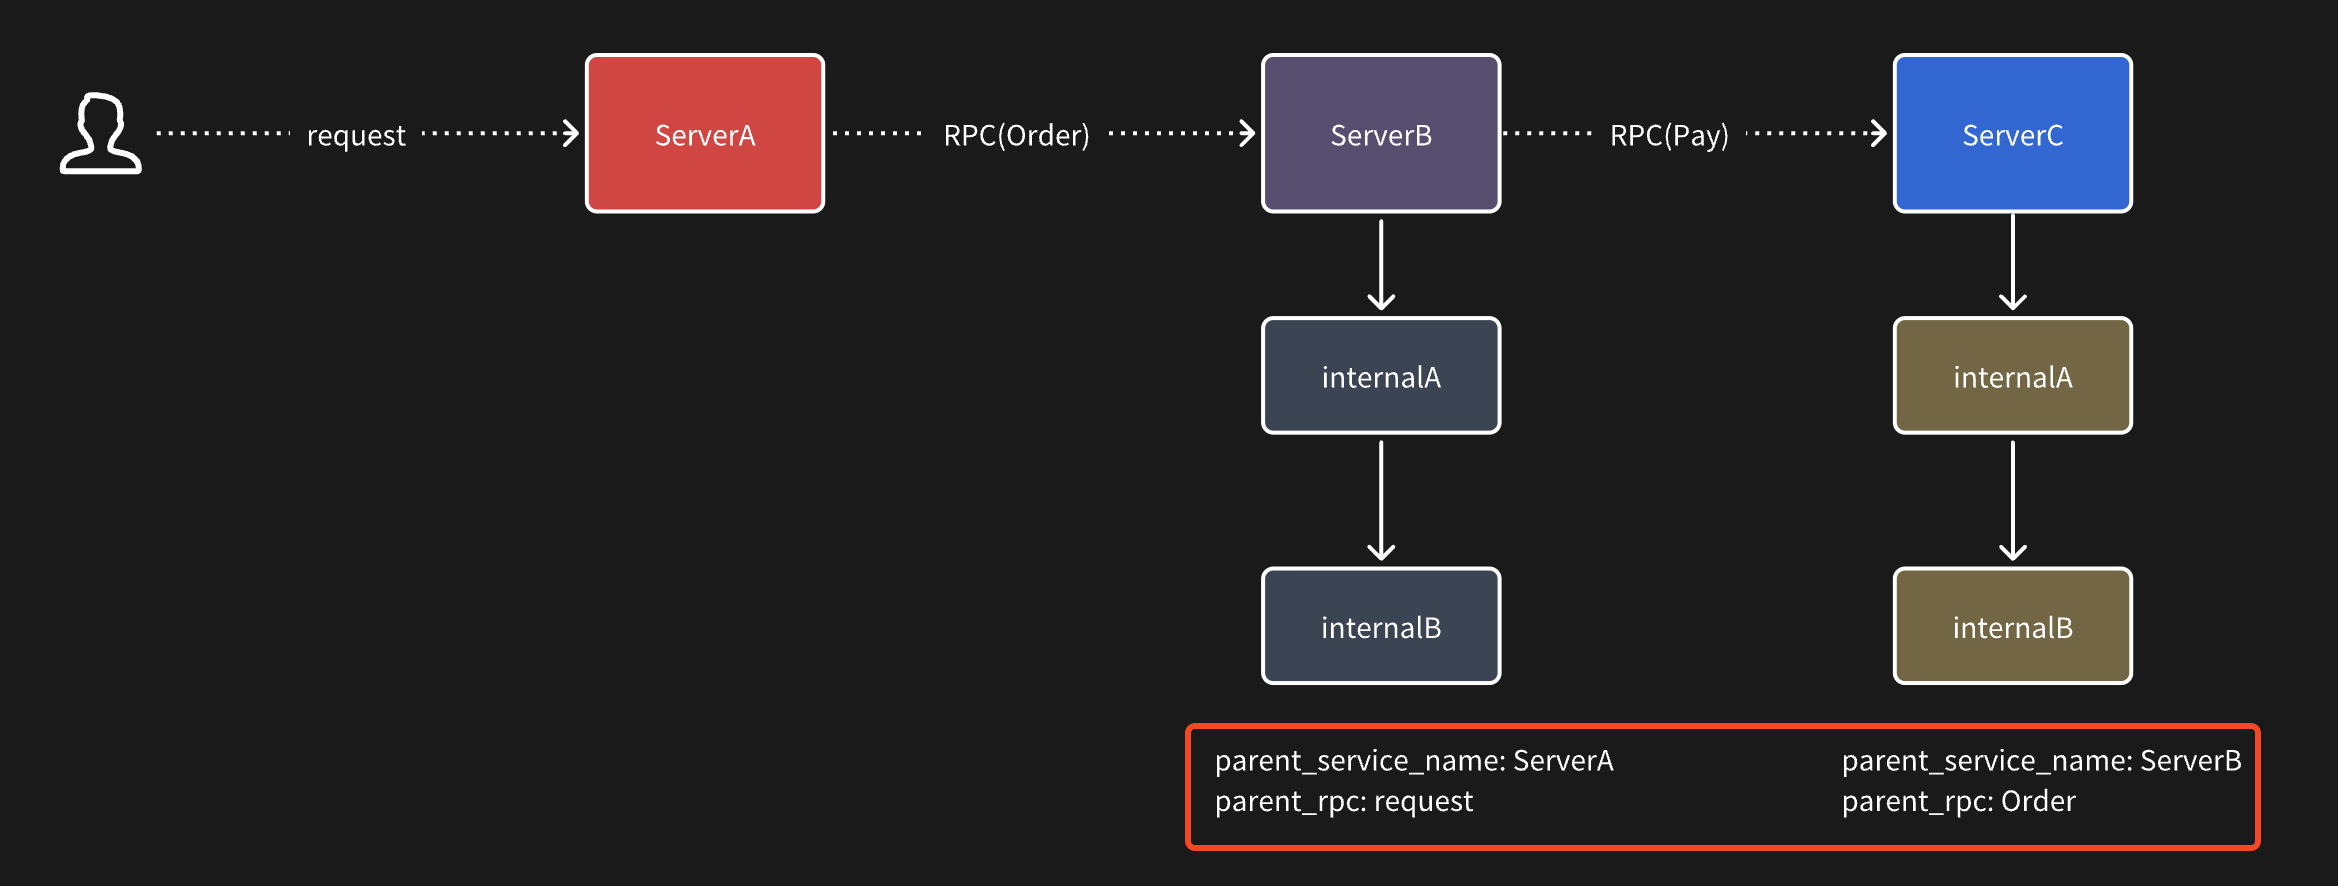
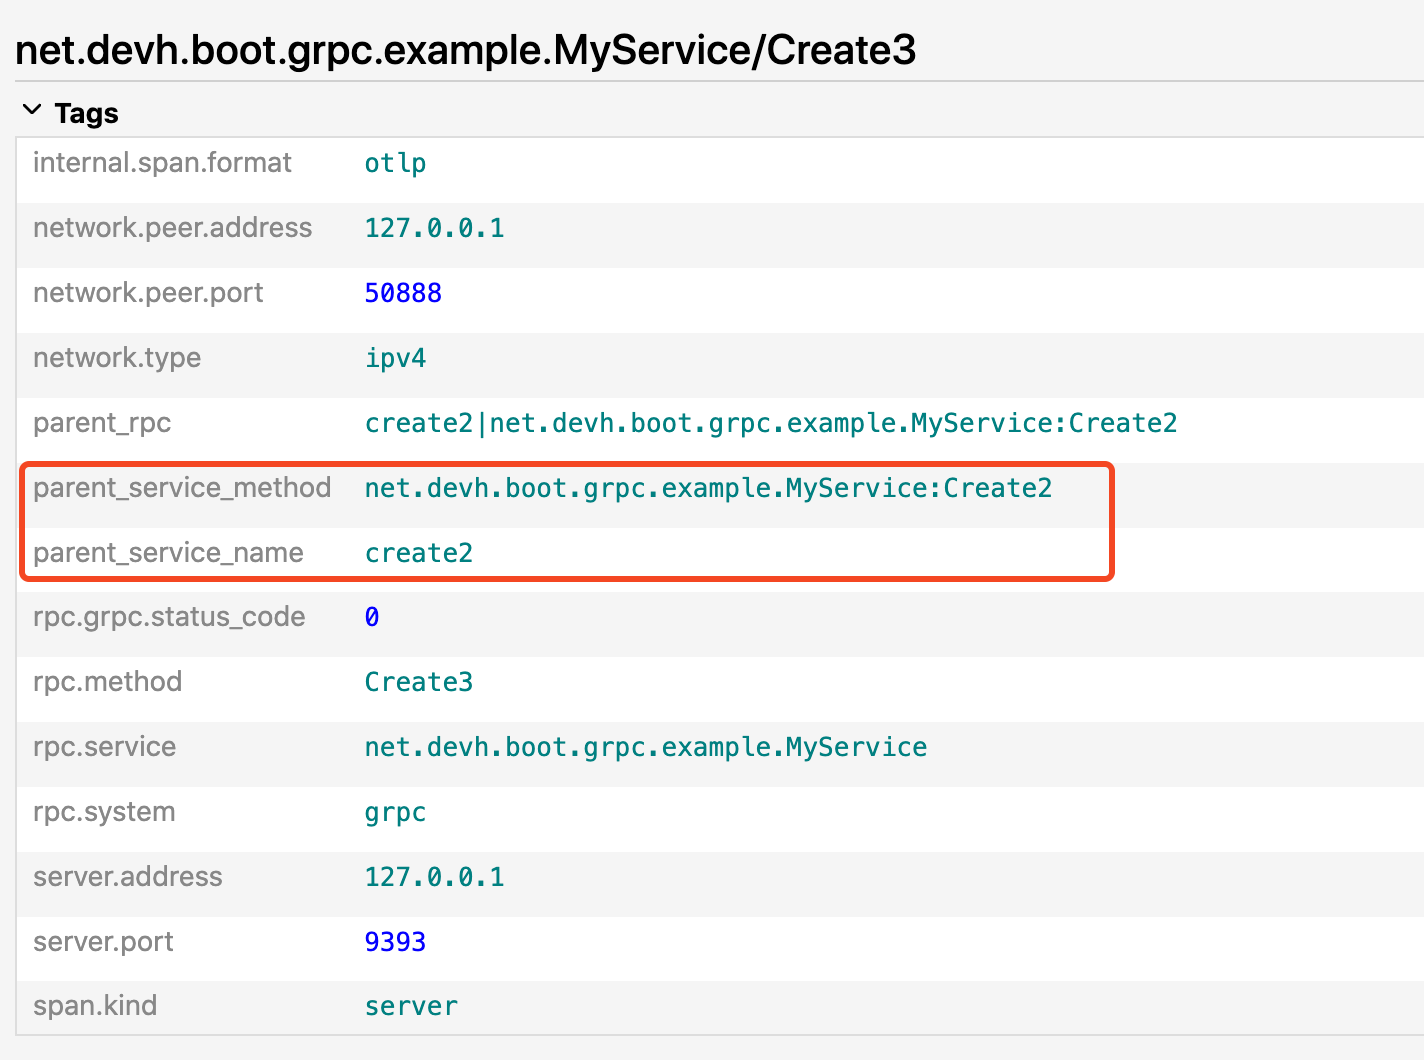
为此我们希望的效果是可以通过给每一个子 span 中加入两个 attribute,来标明它的父调用来源。
比如在 serviceB 中的所有 span 中都会加上两个标签:来源是 serviceA,同时是 serviceA 的 request 接口发起的请求。
而在 serviceC 中同样可以知道来源是 serviceB 的 Order 接口发起的调用。
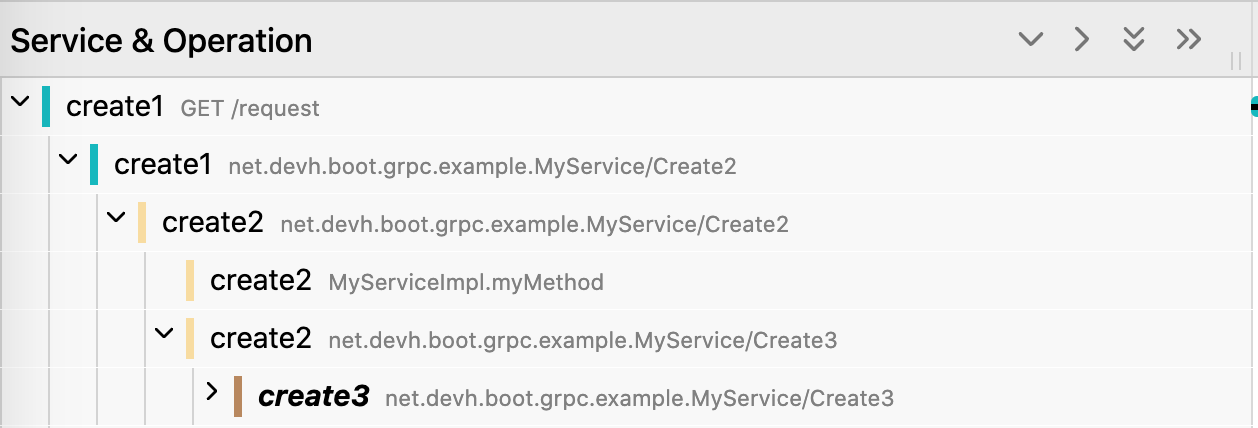
我启动了三个 demo 应用,分别是 create1,create2,create3.
create1 中会提供一个 request 接口,在这里面调用 create2 的 create2 接口,create2 的接口里接着调用 create3 的 create3 接口。
create1:
1
2
3
4
5
6
7
8
9
10
11
@RequestMapping("/request") public String request (@RequestParam String name) { HelloRequest request = HelloRequest.newBuilder() "request: {}" , request); String message = myServiceStub.create2(request).getMessage(); 1 ).execute(() -> { return message;
create2:
1
2
3
4
5
6
7
8
9
10
11
@Override public void create2 (HelloRequest request, StreamObserver<HelloReply> responseObserver) { HelloReply reply = HelloReply.newBuilder() "Create2 ==> " + request.getName()) "Create2: {}" , reply.getMessage());
create3:
1
2
3
4
5
6
7
8
9
10
@Override public void create3 (HelloRequest request, StreamObserver<HelloReply> responseObserver) { HelloReply reply = HelloReply.newBuilder() "Create3 ==> " + request.getName()) "Create3: {}" , reply.getMessage());
1
2
3
4
5
6
7
8
9
java -javaagent:opentelemetry-javaagent-2.4.0-SNAPSHOT.jar \
只是每个应用都需要使用我这边单独打的 agent 包以及一个 extension(tel-extensions-custom-context-1.0-SNAPSHOT.jar) 才能生效。
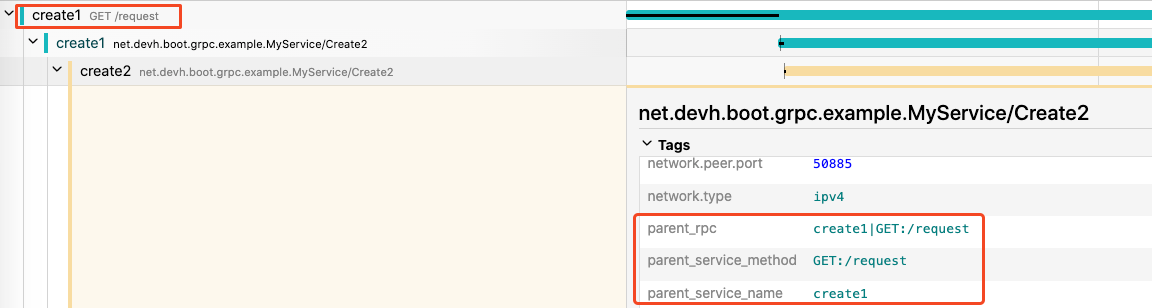
最终的效果如下:
Baggage 在讲具体的实现之前需要先了解几个 Trace 中的概念,在这里主要用到的是一个称为 Baggage 的对象。
在之前的文章中其实提到过它的原理以及使用场景:从 Dapper 到 OpenTelemetry:分布式追踪的演进之旅
Baggage 的中文翻译是:包裹📦;简单来说就是我们可以通过自定义 baggage 可以将我们想要的数据存放在其中,这样再整个 Trace 的任意一个 Span 中都可以读取到。
1
2
3
4
5
6
7
8
9
10
11
@RequestMapping("/request") public String request (@RequestParam String name) { "request.name" , name).build() String value = Baggage.current().getEntryValue("request.name" ); "request.name: {}" , value);
理解了这个之后,我们要实现的将上游的信息传递到下游就可以通过这个组件实现了。
只需要在上游创建 span 时将它自身数据写入到 Baggage 中,再到下游 span 取出来写入到 attribute 中即可。
ContextCustomizer 这里的关键就是在哪里写入这个 Baggage,因为对第三方组件的 Instrumentation 的实现都是在 opentelemetry-java-instrumentation 项目中。
javaagent.jar 包也是通过该项目打包出来的。
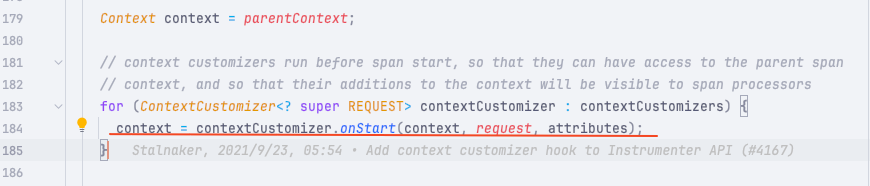
所以在该项目的 io.opentelemetry.instrumentation.api.instrumenter.Instrumenter#doStart 这个函数中我们发现一段逻辑:
这个函数是在创建一个 span 的时候调用的,通常这个创建函数是在这些第三方库的拦截器中创建的。
1 2 3 4 5 for (ContextCustomizer<? super REQUEST> contextCustomizer : contextCustomizers) {
ContextCustomizer 是一个接口只提供了一个函数:
1
2
3
4
5
public interface ContextCustomizer <REQUEST> { onStart (Context parentContext, REQUEST request, Attributes startAttributes) ;
Context 是上下文信息,可以在自定义的 ContextCustomizer 继续往上下文中追加信息。REQUEST 是一个泛型:一般是当前第三方组件的请求信息:
比如是 HTTP 时,这个 request 就是 HTTP 的请求信息。
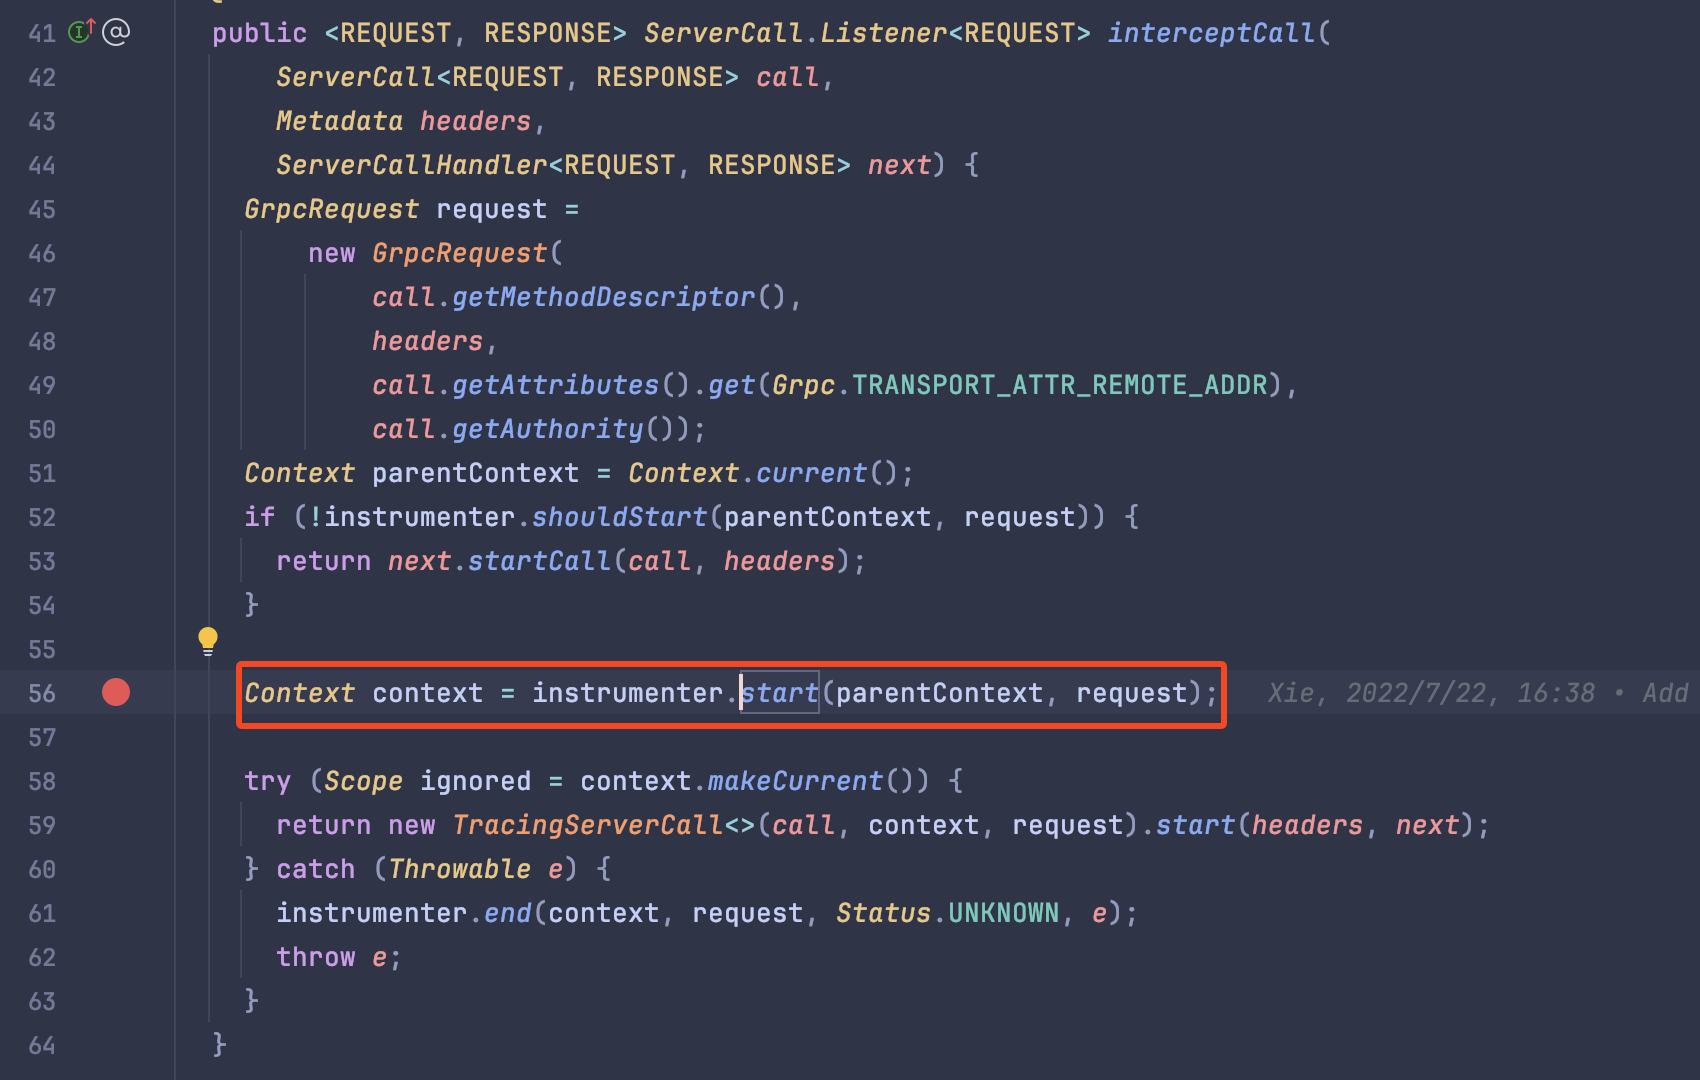
而如果是 gRPC ,则是 gRPC 的请求信息。
其他的请求类型同理。
startAttributes 则是预先写入的一些属性,比如在上图中看到的一些 rpc.service/rpc.method等字段。
从这个接口的调用注释可以看出:SpanProcessor 访问到。
SpanProcessor 而 SpanProcessor 又是一个非常的重要的组件,我们接着刚才的 contextCustomizer 处往后跟踪代码。
1 2 3 4 5 context = contextCustomizer.onStart(context, request, attributes);Span span = spanBuilder.setParent(context).startSpan();
可以看到 spanProcessor.onStart 这个函数会在 contextCustomizer 之后调用。
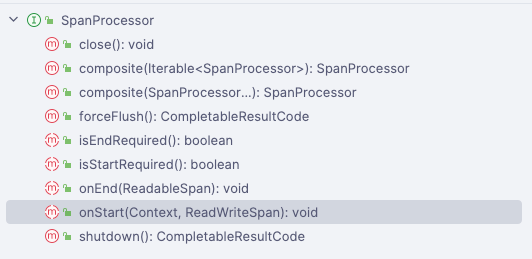
1 2 3 4 5 6 7 8 9 10 11 12 13 14 15 void onStart (Context parentContext, ReadWriteSpan span) ;
从注释中可以知道 SpanProcessor 是作为一个 span 的生命周期中的关键节点的 hook 函数。
在这些函数中我们可以自定义一些 span 的数据,比如在 onStart 还可以往 span 中写入一些自定义的 attribute。
这也是我们这次会用到的一个接口,我们的方案是:
在 gRPC 构建 Instrument 时自定义一个 GrpcServerContextCustomizer ,在这个自定义的 ContextCustomizer 中写入一个 Baggage。
然后在 io.opentelemetry.sdk.trace.SpanProcessor#onStart 接口中取出这个 Baggage 写入到当前 span 的 attribute 中。
这样我们就可以看到之前提到的那些数据上游信息了。
为 gRPC 添加上下文 先来看看如何为 gRPC 添加 Baggage:
我们先自定义一个 GrpcServerContextCustomizer 实现类:
1 2 3 4 5 6 7 8 9 10 11 12 13 14 15 16 17 18 19 20 21 22 23 24 25 26 27 28 29 30 31 32 33 34 35 36 37 38 39 40 41 public class GrpcServerContextCustomizer implements ContextCustomizer <GrpcRequest> { private final String currentServiceName; private static final String PARENT_RPC_KEY = "parent_rpc" ; private static final String CURRENT_RPC_KEY = "current_rpc" ; private static final String CURRENT_HTTP_URL_PATH = "current_http_url_path" ; public GrpcServerContextCustomizer (String serviceName) { this .currentServiceName = serviceName; @Override public Context onStart (Context parentContext, GrpcRequest grpcRequest, Attributes startAttributeds) { BaggageBuilder builder = Baggage.fromContext(parentContext).toBuilder(); String currentRpc = Baggage.fromContext(parentContext).getEntryValue(CURRENT_RPC_KEY); String fullMethodName = startAttributeds.get(AttributeKey.stringKey("rpc.method" )); String rpcService = startAttributeds.get(AttributeKey.stringKey("rpc.service" )); String method = rpcService + ":" + fullMethodName; String baggageInfo = getBaggageInfo(currentServiceName, method); String httpUrlPath = Baggage.fromContext(parentContext).getEntryValue(CURRENT_HTTP_URL_PATH); if (!StringUtils.isNullOrEmpty(httpUrlPath)) { Baggage baggage = builder return parentContext.with(baggage); private static String getBaggageInfo (String serviceName, String method) { if (StringUtils.isNullOrEmpty(serviceName)) { return "" ; return serviceName + "|" + method;
从这个代码中可以看出,我们需要先从上下文中获取 CURRENT_RPC_KEY ,从而得知当前的 span 是不是 root span。
所以我们其实是把当前的 span 信息作为一个 PARENT_RPC_KEY 写入到 Baggage 中。
这样在 SpanProcessor 中便可以直接取出 PARENT_RPC_KEY 作为上游的信息写入 span 的 attribute 中。
1
2
3
4
5
6
7
8
9
10
@Override public void onStart (Context parentContext, ReadWriteSpan span) {String parentRpc = Baggage.fromContext(parentContext).getEntryValue("parent_rpc" ); if (!StringUtils.isNullOrEmpty(parentRpc)) { "\\|" ); "parent_rpc" , parentRpc); "parent_service_name" , split[0 ]); "parent_service_method" , split[1 ]);
需要注意的是,这里的 Baggage 需要使用 Baggage.fromContext(parentContext) 才能拿到刚才写入 Baggage 信息。
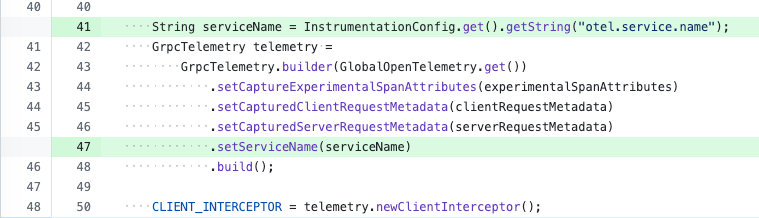
之后我们找到构建 gRPCServerInstrumenterBuilder 的地方,写入我们刚才自定义的 GrpcServerContextCustomizer 即可。
1 .addContextCustomizer(new GrpcServerContextCustomizer (serviceName))
这里我们选择写入到是 serverInstrumenterBuilder 而不是clientInstrumenterBuilder,因为在服务端的入口就知道是从哪个接口进来的请求。
为 spring boot 的 http 接口添加上下文 如果只存在 gRPC 调用时只添加 gRPC 的上下文也够用了,但是我们也不排除由外部接口是通过 HTTP 访问进来的,然后再调用内部的 gRPC 接口;这也是非常常见的架构模式。
所以我们还需要在 HTTP 中增加 ContextCustomizer 将自身的数据写入到 Baggage 中。
好在 HttpServerRouteBuilder 自身是实现了 ContextCustomizer 接口的,我们只需要往里面写入 Baggage 数据即可。
1
2
3
4
5
6
7
8
9
10
11
12
13
14
15
16
17
18
19
20
21
public ContextCustomizer<REQUEST> build () { new HashSet <>(this .knownMethods); return (context, request, startAttributes) -> { if (HttpRouteState.fromContextOrNull(context) != null ) { return context; String method = getter.getHttpRequestMethod(request); if (method == null || !knownMethods.contains(method)) { "HTTP" ; String urlPath = getter.getUrlPath(request); String methodPath = method + ":" + urlPath; String currentRpc = Baggage.fromContext(context).getEntryValue(CURRENT_RPC_KEY); String baggageInfo = getBaggageInfo(serviceName, methodPath); Baggage baggage = Baggage.fromContext(context).toBuilder() return context.with(HttpRouteState.create(method, null , 0 ))
这里新增了 CURRENT_HTTP_URL_PATH 用于标记当前的请求来源是 HTTP,在 grpc 的 ContextCustomizer 解析时会判断这个值是否为空。
1
2
3
4
5
String httpUrlPath = Baggage.fromContext(parentContext).getEntryValue(CURRENT_HTTP_URL_PATH); if (!StringUtils.isNullOrEmpty(httpUrlPath)) {
这样就可以在 grpc 的下游接口拿到入口的 HTTP 接口数据了。
当然也有可能是在 grpc 接口中调用 HTTP 的接口的场景,只是我们的业务中没有这种情况,所以就没有适配这类的场景。
总结 ContextCustomizer 接口没有提供对应的扩展,但是 SpanProcessor 是提供了扩展接口的。
原本是想尽量别维护自己的 javaagent,但也好在 OpenTelemetry 是提供的接口,所以也并不会去修改原本的代码。
所以我们还是需要创建一个 extensions 的项目在实现 SpanProcessor,这个在之前的 《实战:如何编写一个 OpenTelemetry Extensions》 有详细讲到。
所以最后的应用启动方式如下:
1
2
java -javaagent:opentelemetry-javaagent-2.4.0-SNAPSHOT.jar \
需要使用我们手动打包的 javaagent 以及一个自定义扩展包。
打包方式:
opentelemetry-java-instrumentation 项目比较大,所以打包过程可能比较久。
因为这其实是一些定制需求,所以就没提交到上游,感兴趣的可以自行合并代码测试。
最后可以这个分支中查看到修改的部分:https://github.com/crossoverJie/opentelemetry-java-instrumentation/compare/main...add-grpc-context